
District Profile
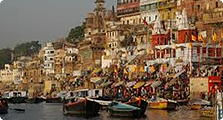
The district Kushinagar is named after sacred death place of Lord Buddha. The area of the district is 2873.50 sq. km. and lies on the eastern fringe of Uttar Pradesh bordering the state of Bihar. Total population of the district is 28.93 lakhs with density of 1007 persons per square km. The district demography is predominantly rural, high level of poverty and low percentage of working population.
The district is divided into 14 blocks with 1571 villages. The brief socio-economic and technological profile of the district is given in Table 1. The district is primarily agrarian with 77 per cent of area under cultivation. The district falls under the middle Gangetic (North – East) plains having alluvial soil. The net area sown is 233166 hectares with 1.67 lakh hectares area under irrigation. More than 91 per cent of the area is owned by small and marginal farmers (Table 1).
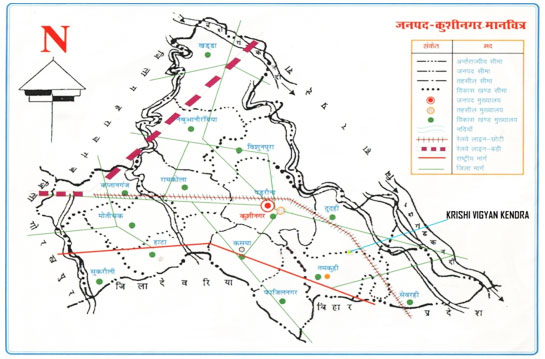
Map of District Kushinagar
Socio - Economic and technological profile of agriculture
| S.N. | Item | Characteristics | Value |
|---|---|---|---|
| 1 | 1.1 1.2 1.3 1.4 1.5 1.6 1.7 |
Geographical area (Sq km) Forest (ha) Net sown area (000 ha) Area sown more than once (000 ha) Cropping intensity (%) Fallow land (ha) Land not available for cultivation (ha) |
2906 818 223,166 125,263 156.1 % 5156 50,859 |
| 2 | 2.1 2.2 2.3 2.4 |
Administrative No of blocks No of Nyaya Panchayat No of villages inhabited and electrified No of villages with potable water supply |
14 141 1084 electrified out of 1571 1571 |
| 3 | Rainfall (mm) | 1200 (1227 mm in 2006) | |
| 4 | Agro-climatic region and zone | Middle Gangetic Plain (North - East) | |
| 5 | Population (,ooo) Male (000) Female (000) Families below poverty line (000) |
2891.68 1472.84 1418.84 202372 |
|
| 6 | Literacy Total (%) Male Female |
46.9 % 63.6 % 29.6 % |
|
| 7 | 7.1 7.2 7.3 7.4 |
Nationalized bank branches Regional Rural Banks Cooperative Banks Cooperative and Village Development Bank |
43 53 24 3 |
| 7 | Literacy Total (%) Male Female |
46.9 % 63.6 % 29.6 % |
|
| 8 | 8.1 8.2 8.3 8.4 8.5 |
Cultivators Of whom small & marginal ones Agricultural labourers Artisans Household/cottage industries |
285,698 275,698 157,530 42,406 22,642 |
| 9 | 9.1 9.2 9.3 9.4 |
Irrigation Net irrigated area (ha) By channels (ha) Tube wells (ha) Other (ha) |
167104 59474 87811 19819 |
| 10 | Chemical fertilizers ( kg per ha) | 156 Kg | |
| 11 | 11.1 11.2 11.3 11.4 11.5 |
Seed/fertilizers/pesticides depots Rural markets/ mandis (No.) Rural Godowns Cold Storage Agro Service Centre |
413 / 399 / 399 9 383 2 128 |
| 12 | 12.1 12.2 12.3 12.4 |
Dairy animals Cattle (cows) Buffaloes Sheep/goat Poultry birds |
151273 198312 282737 236623 |
Source : Official website of Govt of U.P. And Department of Agriculture, U.P.
Distribution of Operational Holdings
| Farm Size (ha) | Operational Holdings | Area Operated |
|---|---|---|
| Up to 1 | Number : 372538 % : 88.51 |
ha : 140458 % : 59.81 |
| 1 - 2 | Number : 34357 % : 8.16 |
ha : 48607 % : 20.70 |
| 2 - 4 | Number : 11362 % : 2.70 |
ha : 30081 % : 12.81 |
| 4 - 10 | Number : 2472 % : 0.59 |
ha : 13164 % : 5.61 |
| Above 10 | Number : 160 % : 0.40 |
ha : 2449 % : 1.04 |
| Total | Number : 420889 % : 100 |
ha : 234819 % :100 |
Source : Official website of Govt of U.P. And Department of Agriculture, U.P.
Crop Sector
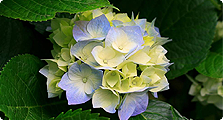
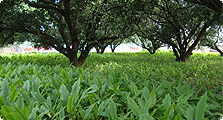
The major crops of the district are paddy, wheat, maize, pulses, potato, vegetables and mango. Sugarcane is the main cash crop of the district. The district has a prominent place in fruits and vegetables cultivation. The important crops cultivated on commercial basis are mango, litchi, banana, okra, pea etc.
Major Food and Commercial Crops – Paddy, sugarcane, wheat, lentil, mustard, mango, etc.
Area, Production and Productivity of major crops in district Kushinagar
| S.N. | Crop | Area (ha) | Production (MT) | Productivity (q/ha) |
|---|---|---|---|---|
| 1 | Paddy | 123013 | 312045 | 25.37 |
| 2 | Wheat | 113722 | 219872 | 19.33 |
| 3 | Maize | 5698 | 10872 | 19.08 |
| 4 | Barley | 96 | 96 | 10.00 |
| 5 | Lentil | 3773 | 1875 | 4.97 |
| 6 | Urd | 217 | 126 | 5.81 |
| 7 | Pea | 507 | 592 | 11.67 |
| 8 | Pigeon Pea | 937 | 662 | 7.06 |
| 9 | Mustard | 9697 | 7481 | 7.71 |
| 10 | Sugarcane | 68739 | 3622270 | 526.96 |
| 11 | Potato | 1537 | 34524 | 224.62 |
| 12 | Turmeric | 796 | 2927 | 36.77 |
Source : Official website of Govt of U.P. And Department of Agriculture, U.P.
Details of Fertilizers availability through different sources in district Kushinagar (MT)
| S.N. | Block | Nitrogen | Phosphorus | Potash | Total |
|---|---|---|---|---|---|
| 1 | Kaptanganj | 2558 | 918 | 366 | 3842 |
| 2 | Ramkola | 2453 | 866 | 351 | 3670 |
| 3 | Motichak | 2147 | 1042 | 321 | 3510 |
| 4 | Sukrauli | 2697 | 885 | 366 | 3948 |
| 5 | Hata | 2380 | 1031 | 351 | 3762 |
| 6 | Khadda | 1854 | 952 | 365 | 3171 |
| 7 | Nebua Naurangia | 2224 | 909 | 292 | 3425 |
| 8 | Vishunpura | 2071 | 788 | 311 | 3170 |
| 9 | Padrauna | 3165 | 853 | 411 | 4429 |
| 10 | Kasya | 2177 | 695 | 162 | 3034 |
| 11 | Dudohi | 2769 | 1108 | 266 | 4143 |
| 12 | Fazilnagar | 2566 | 857 | 340 | 3763 |
| 13 | Tamkuhi | 3778 | 894 | 411 | 5083 |
| 14 | Sevrahi | 3150 | 1137 | 250 | 4537 |
Source : Official website of Govt of U.P. And Department of Agriculture, U.P.
Details of Fertilizers availability through different sources in district Kushinagar (MT)
| S.N. | Block | Paddy | Wheat | Maize | Arhar | Lentil | Mustard | Sugarcane | Potato |
|---|---|---|---|---|---|---|---|---|---|
| 1 | Kaptanganj | 9778 | 7861 | 187 | 15 | 313 | 663 | 4331 | 92 |
| 2 | Ramkola | 8420 | 7610 | 334 | 31 | 138 | 1145 | 7842 | 41 |
| 3 | Motichak | 8841 | 7820 | 191 | 31 | 271 | 318 | 3540 | 67 |
| 4 | Sukrauli | 9498 | 8388 | 112 | 23 | 126 | 473 | 3905 | 78 |
| 5 | Hata | 9071 | 8706 | 327 | 24 | 229 | 623 | 2976 | 46 |
| 6 | Khadda | 7807 | 6217 | 375 | 96 | 374 | 1439 | 8540 | 58 |
| 7 | Nebua Naurangia | 7315 | 6197 | 205 | 49 | 281 | 1360 | 6623 | 83 |
| 8 | Vishunpura | 7760 | 6835 | 370 | 102 | 312 | 1205 | 7996 | 102 |
| 9 | Padrauna | 12028 | 10581 | 925 | 124 | 405 | 753 | 8175 | 122 |
| 10 | Kasya | 7534 | 6889 | 865 | 36 | 156 | 535 | 3388 | 134 |
| 11 | Dudohi | 8583 | 10880 | 701 | 152 | 305 | 364 | 3931 | 152 |
| 12 | Fazilnagar | 8827 | 8702 | 263 | 115 | 243 | 235 | 1607 | 212 |
| 13 | Tamkuhi | 8620 | 9475 | 417 | 76 | 302 | 318 | 3309 | 212 |
| 14 | Sevrahi | 8364 | 7126 | 416 | 58 | 318 | 237 | 2006 | 134 |
Source : Official website of Govt of U.P. And Department of Agriculture, U.P.
Details of Fertilizers availability through different sources in district Kushinagar (MT)
| S.N. | Crop | Area (ha) | Production (MT) | Productivity (t/ha) |
|---|---|---|---|---|
| 1 | Mango | 4374 | 16191 | 3.702 |
| 2 | Litchi | 52 | 163 | 3.135 |
| 3 | Guava | 17 | 147 | 8.647 |
| 4 | Banana | 194 | 7035 | 36.366 |
| 5 | Jackfruit | 83 | 2075 | 25.00 |
| 6 | Cauliflower | 201 | 4045 | 20.124 |
| 7 | Brinjal | 83 | 2227 | 30.507 |
| 8 | Okra | 199 | 1967 | 9.884 |
| 9 | Cabbage | 84 | 1906 | 22.690 |
| 10 | Green Pea | 290 | 2389 | 8.238 |
| 11 | Bottle Gourd | 56 | 1543 | 27.554 |
| 12 | Onion | 71 | 976 | 11.620 |
Source : Official website of Govt of U.P. And Department of Agriculture, U.P.
Livestock Sector
Dairy development in recent times has assumed great importance as an allied activity to agriculture. Besides, due to nutrient value of dairy products, the activity is also being practiced on commercial basis. Even under SGSY and Special Component Plan, this activity is being financed as a main activity with a view to provide employment throughout the year. Animal husbandry sector within agriculture sector contributes more than 25% of total value of output.
Kushinagar district is dominated by small and marginal farmers. To generate additional income, each small farmer keeps three animals on an average. The district has facilities of veterinary hospitals, livestock development centres and artificial insemination centres. However the support activities are not adequate as there has been substantial increase in dairy activity due to its adoption by inhabitants on massive scale. At present 1552 poultry units are active in the district, but the egg production is very low.
According to the available data there are about 1388 ponds covering 862 ha of land ranging in size between 0.2 ha to 5 ha which can be exploited for promotion of fisheries.
Lack of FYM and use of cow dung for burning has added to depletion of organic matter in the soil. A number of suggestions are being proposed to improve soil health and cattle management with a view to upgrade the productivity of crops as well as cattle.
Dairy Profile of Kushinagar District
| S.N. | ||
|---|---|---|
| 1 | Population of breedable Cross bred cows | 15144 |
| 2 | Population of breedable Desi Cows | 42632 |
| 3 | Population of breedable Buffaloes | 100198 |
| 4 | Total Milk production (000MT) | 948 |
| 5 | Livestock Development Centres | 40 |
| 6 | Artificial Insemination Centres | 27 |
| 7 | Goat Farm | 1 |
| 8 | Sheep Development Centre | 1 |
| 9 | Pig development Centres | 5 |
| 10 | Poultry Unit | 1552 |
| 11 | Piggery Unit | 392 |
| 12 | Number of Milk Societies | 91 |
| 13 | Number of District Milk Cooperative | 0 |
| 14 | District level chilling facility | 0 |
Source : Official website of Govt of U.P. And Department of Agriculture, U.P.